RescueME Local Risk Assessment for Cultural Landscapes
The risk assessment provides a comprehensive methodology to evaluate how climate change impacts coastal Cultural Landscapes. The goal is to move beyond generic risk maps by incorporating the unique socio-ecological-technical characteristics of each region, specifically addressing ecosystem services and cultural heritage values.
The Methodological Approach
Following the IPCC (Fifth and Sixth Assessment Reports) framework, risk is calculated as the intersection of three critical components:
- Hazard: The potential occurrence of a physical event or trend that may cause negative impacts.
- Exposure: The presence of people, livelihoods, species, ecosystems, or assets in places that could be adversely affected.
- Vulnerability: The predisposition to be affected, determined by the intrinsic characteristics of the landscape, including its sensitivity and its capacity to adapt with and respond to potential damage.
How the Risk is Calculated
The process is divided into three interconnected steps:
- Value Characterization: Quantifying ecosystem services and characterizing local heritage values to ensure the model reflects its importance as cultural landscape.
- Hazard Modelling: Running simulations or performing statistical analysis for prioritized threats across different climate scenarios.
- Predictive Impact Modelling: Integrating the above into a relative risk index. This index integrates assigned weights to hazard, exposure, and vulnerability based on expert input from each R-Lab (the RescueME case studies), ensuring that local priorities drive the results.
The technical workflow
The calculation of risk follows a step process to ensure scientific accuracy and local relevance:
- Risk selection and scenarios: Key risks were identified by combining impact chains with local expertise. Time periods and emission scenarios were selected based on data availability and the specific priorities of each R-Lab.
- Model design and data collection: A system of indicators was developed covering natural, built, social, human, and financial capitals. These were linked to hazard, exposure, or vulnerability. Where data scales differed, GIS tools were used to calculate weighted averages to maintain spatial accuracy.
- Normalization and polarisation: Since indicators use different units, they were normalized to a standard scale. Polarities were defined so that indicators of adaptative capacity have a negative polarity, while exposure, hazard and sensitivity have a positive polarity, contributing to a higher level of risk.
- Expert-based weighting: To integrate local knowledge, technical staff from each R-Lab assigned weights to the indicators. Across all R-Labs, vulnerability was consistently given the highest weight, as it is the component most susceptible to improvement through human intervention. In all cases, the ecosystem services index received a high weight within the vulnerability component.
- Index calculation: Using the SIRVA®2 software, the normalized indicators were combined into relative exposure and vulnerability indices. Finally, the composite relative risk index was calculated by combining hazard, exposure, and vulnerability according to their expert-assigned weights.
- Spatial Mapping: The results were linked to GIS layers, producing a series of risk maps. Relative risk indices were grouped into five classes using quantiles as classification method: Higher, Medium-High, Medium, Medium-Low, and Lower.
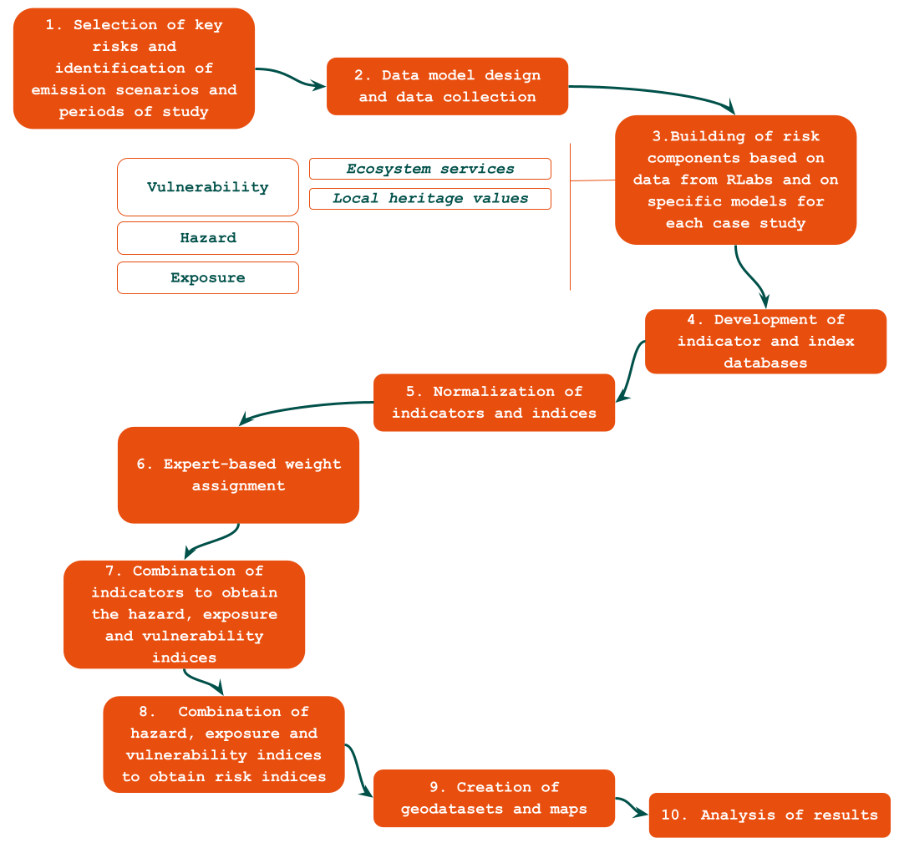
Methodological steps of the Local Risk Assessment.
Key Findings across the R-Labs
The analysis reveals that climate change poses a significant threat to all the analysed cultural landscapes, with many areas expected to reach high or medium-high risk levels by the end of the century:
- Diversified threats: Risks vary by geography. In Neuwerk, storm-related hazards are projected to pose a medium risk to the island’s center; in L’Horta de València, the impact of torrential rainfall on agricultural heritage is expected to increase.
- Critical hazards: Landscapes such as Portovenere, Cinque Terre, and the Islands face a significant increase in landslide risk, while Psiloritis is highly susceptible to temperature-driven risk increases.
- Vulnerability patterns: In Zadar, approximately half of the analyzed buildings are expected to experience medium to higher levels of vulnerability.
For more detailed technical specifications, please refer to Deliverable 1.4.
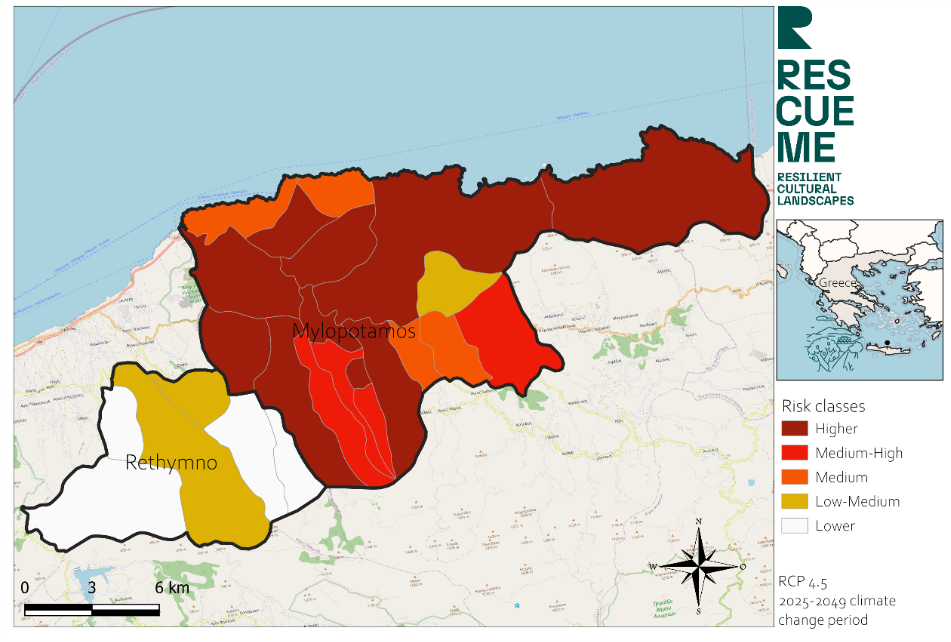
Exemplary result of the Local Risk Assessment: the impact of changes in temperature on culture. RCP 4.5 (2025-2049)